Flowik
Administrative Tools
Role
UX/UI Designer
Tool
Figma, FigmaJam
Team
Functional Analyst, Developers, QA and Project Manager
Duration
3 months

Overview
Flowik is an internal-use web application designed for small and micro businesses that sell products. It allows the management of customers, products, stock, suppliers, debts, and reports from a single administrative panel. The system was developed based on needs identified in a real business (Misino Mascotas) and designed to be applicable to other similar industries.
Problem
SMEs (Small and Medium-sized Enterprises)n often manage their daily operations using manual and fragmented tools, which leads to:
Dependence on Excel, messages, and non-centralized records
Lack of visibility into product status
Difficulty controlling stock and up-to-date pricing
Lack of visibility into customer debts
Objectives
Centralize the management of stock, pricing, and customers in a single system.
Provide clear and up-to-date visibility into stock and product status.
Enable customer debt tracking through a dedicated module with payment history and status.
Reduce daily operational workload through automation of key tasks, such as stock and price updates.
Design a simple and easy-to-adopt tool, intended for users with low technological experience.
Role - UX/UI Designer
Researched the real usage context and administrative processes to understand how stock, pricing, customers, and debts were managed.
Participated in defining the MVP scope, prioritizing key modules and critical flows.
Designed the information architecture and main flows, incorporating business rules (debt management, payments, price adjustments).
Designed the interface and component system (tables, modals, states, and indicators), ensuring consistency across modules.
Collaborated with the development team to align design, functional logic, and implementation.
Process (Summary)
Stakeholder research and analysis of the real usage context
Identification of operational needs and problems
Feature prioritization for the MVP
Design of the main administrative panel flows
UI design based on reusable components
Iterations and adjustments during development
Key Solutions
Manual product creation and bulk import from PDF and Excel, with AI support for data validation.
Product and stock management with a unified view and visual status indicators.
Customer and debt management with tracking, history, and clear states.
Individual and bulk price adjustments with preview before applying changes.
Product export to PDF price lists, always up to date and ready to share.
Results
MVP defined with complete operational modules: Customers (debts), Products (stock and pricing), Suppliers, and Reports.
Critical flows validated: product creation/import, debt management with FIFO (First In, First Out) payments, bulk price adjustments, and price list export.
Key business information visible through tables and dashboards using visual indicators (RAG) indicators and prioritized lists.
Reduction of manual processes by replacing Excel and fragmented records with a single system.
Lessons Learned
In internal management tools, the use of visual indicators (RAG) and prioritized lists facilitates quick understanding of business status and operational decision-making.
Automating specific tasks (imports, bulk pricing) has an immediate impact on daily operations.
Defining business rules from a UX perspective (debts, payments, validations) prevents ambiguity in design and development.
Next Steps
User and role management with permissions and operational hierarchies.
Responsive version for mobile devices and tablets.
Financial modules: accounts payable, cash and banks, reconciliations, and cash flow.
Commercial management: sales, orders, and end-to-end purchase tracking.
Integration with external systems: electronic invoicing, payment methods, and other sales channels.
Advanced reports with operational, commercial, and financial metrics.
Screens
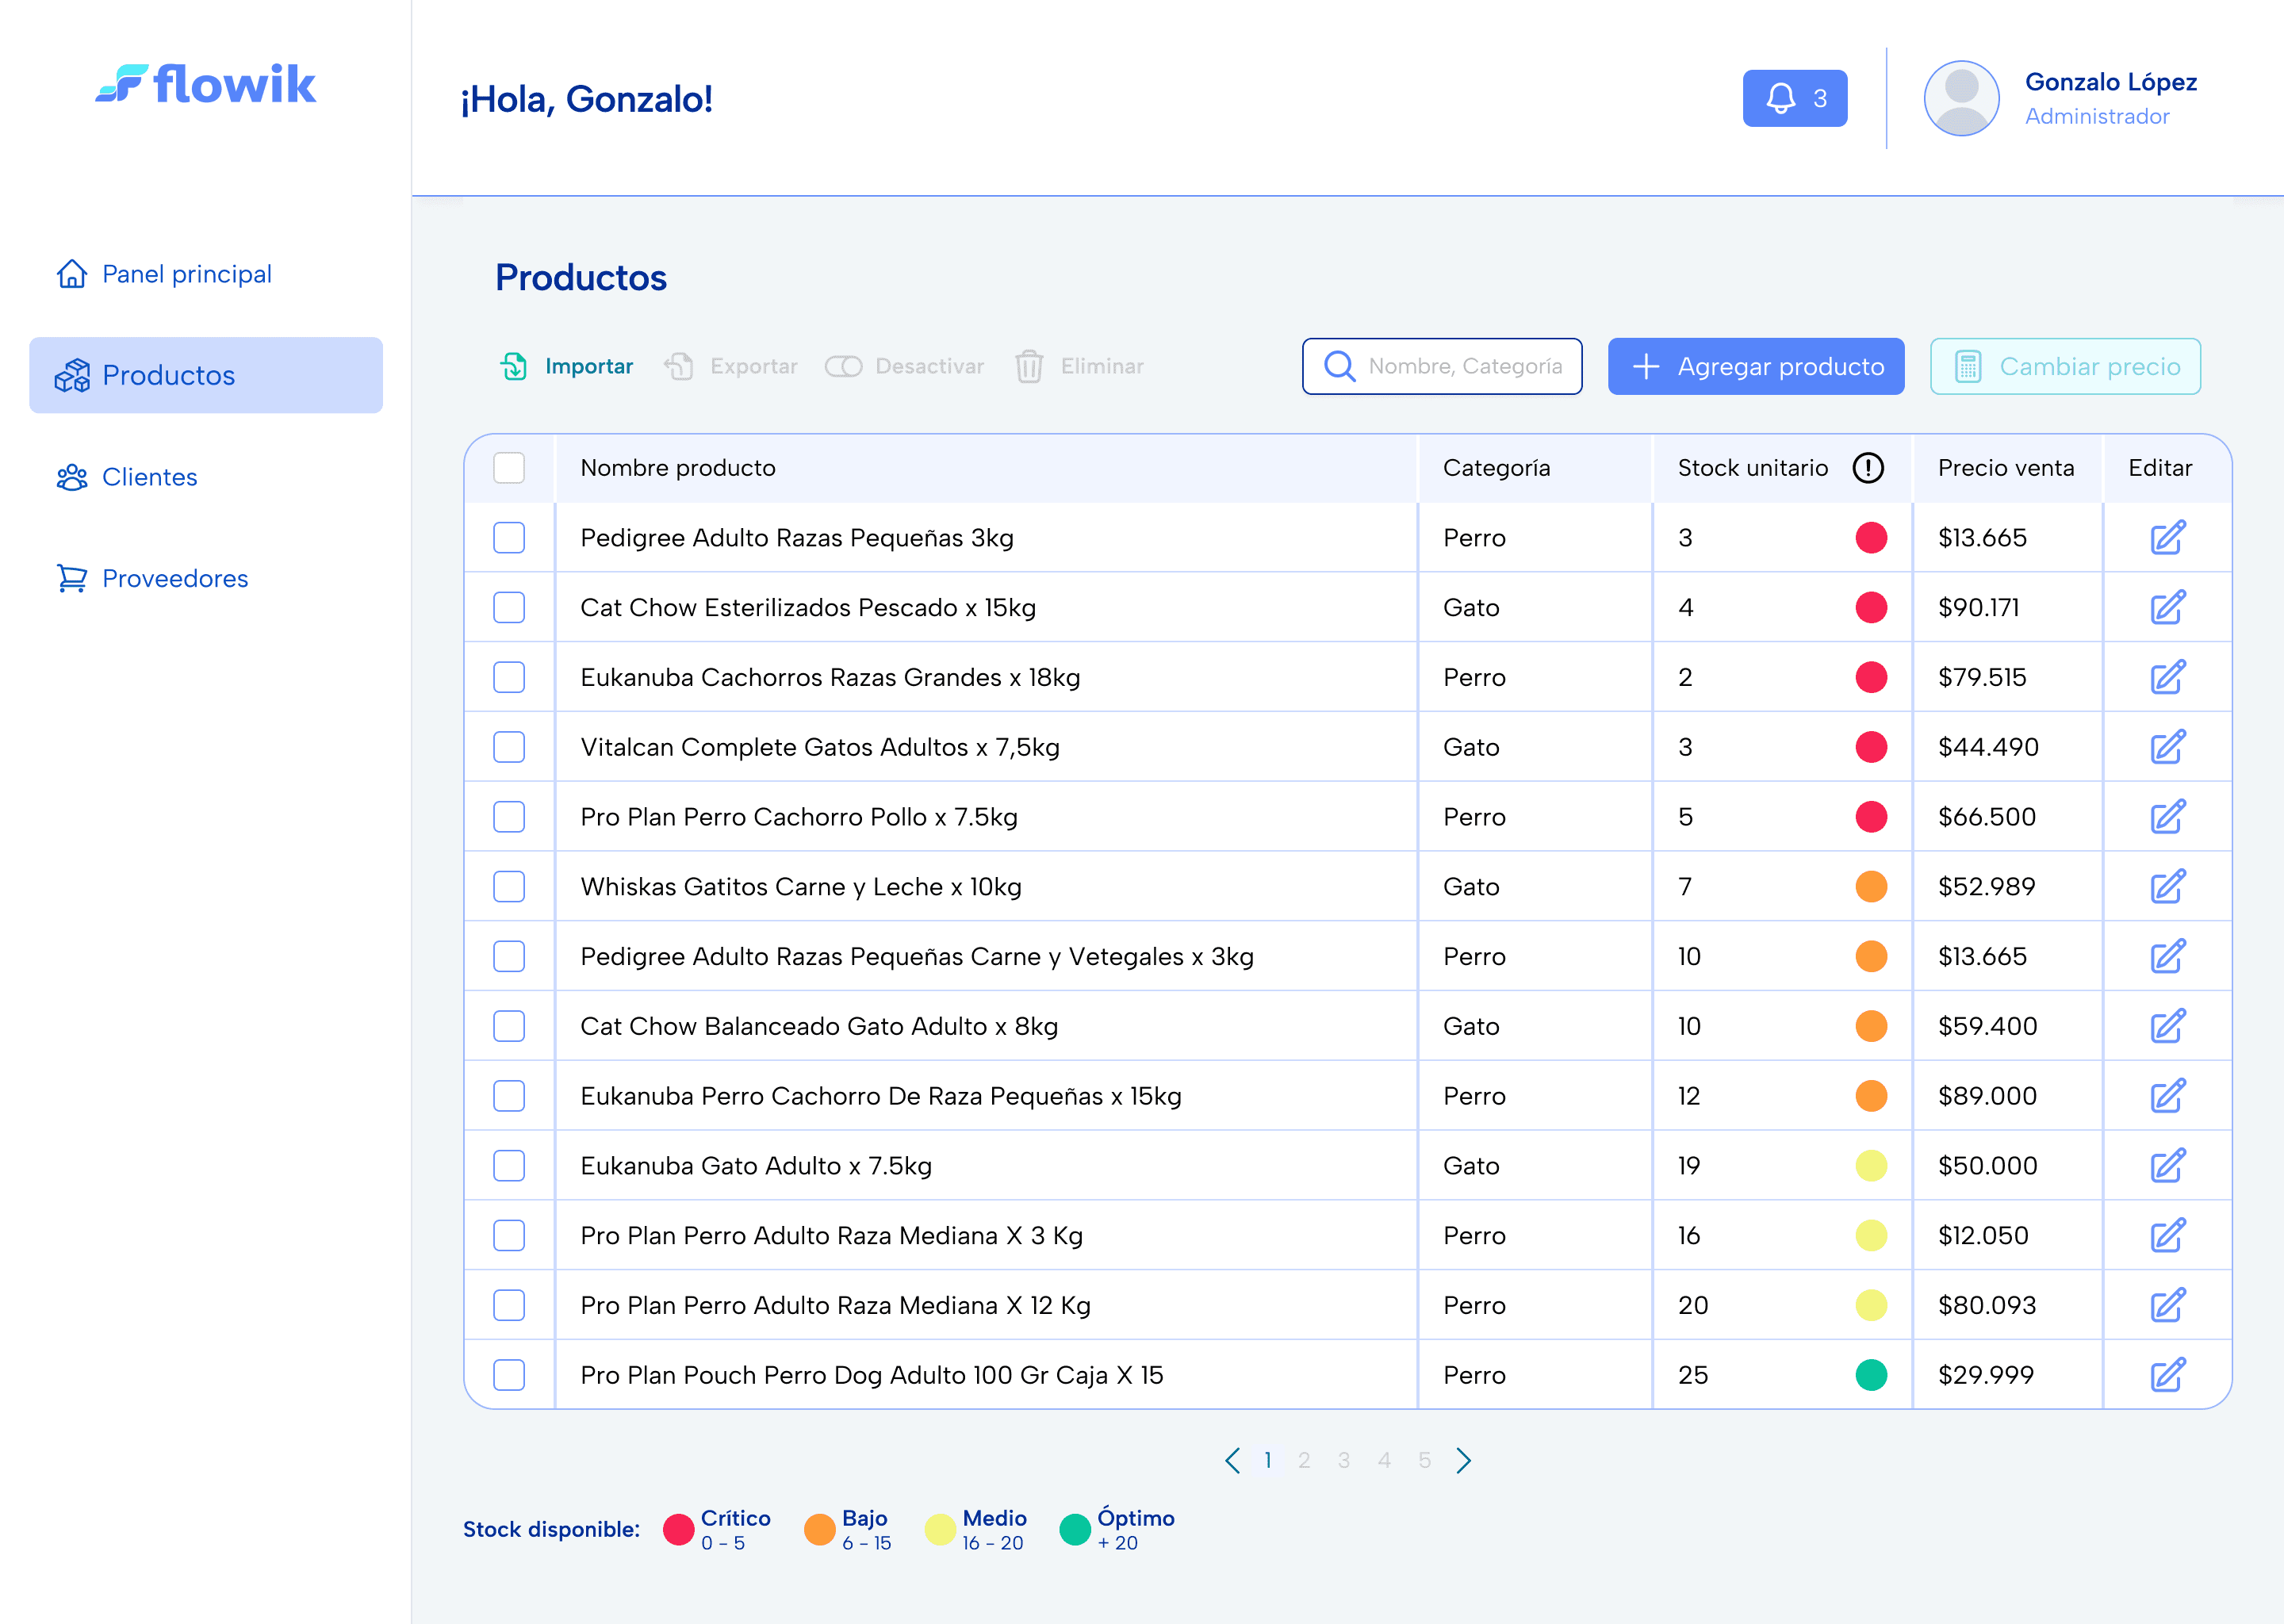
Products list
Main product management view displaying product name, category, stock level, and price in a structured table.
Uses RAG visual indicators to quickly identify critical, low, medium, and optimal stock levels and prioritize actions.
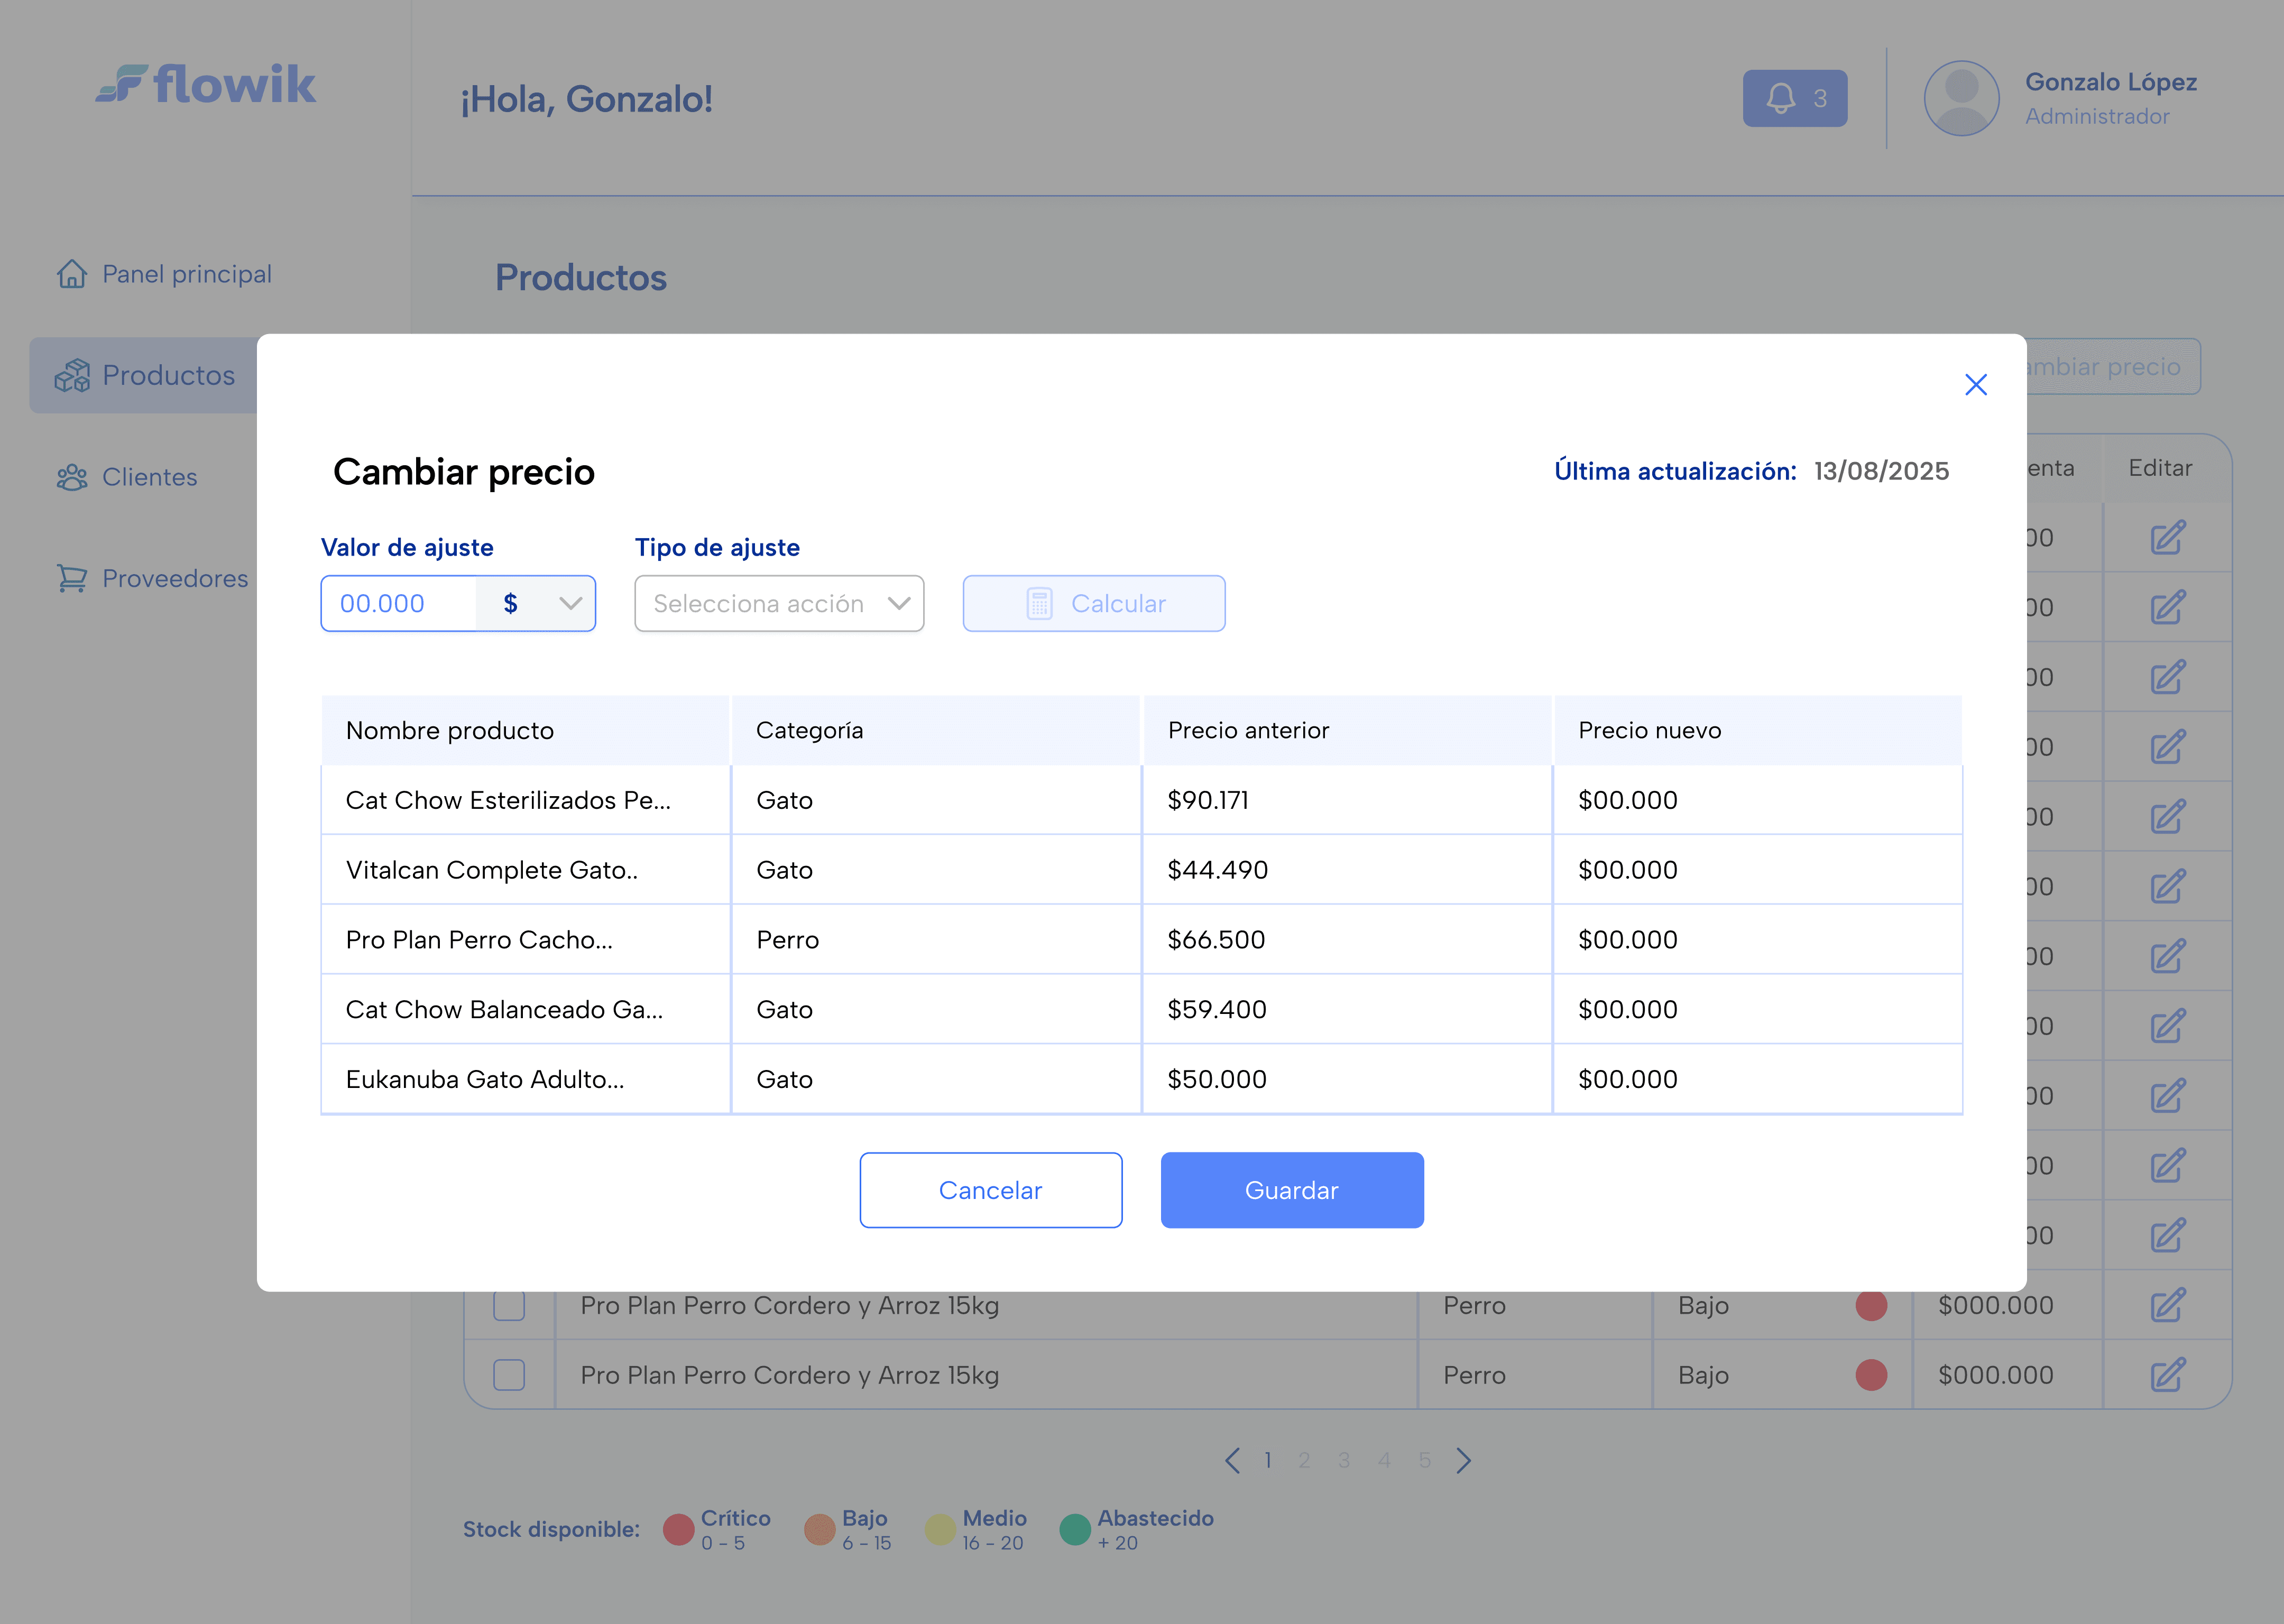
Bulk price update
Modal designed to update prices in bulk across multiple products.
Allows adjustments by percentage or fixed amount, with a price preview before saving to reduce errors and ensure control